Four must-haves for 21st century risk management

Whether you are focused on improving vendor risk management practices, tracking certificates of insurance or coping with the burgeoning requirements of GRC (governance, risk, compliance), one thing is certain – the workload imposed on risk managers is broadening in both scope and complexity.
Consider just one element – data. 90% of all the data in the world has been generated in the last 24 months. Really. How much of it is on your desk? Conversely, how much of it should be?
More to the point, information both within and outside your organization can be a primary and valuable source of informed decision-making, but only if you can get to it, make it relevant for your purpose and to be able to analyze and act on what you learn.
Basically, what you need is a user-defined platform for managing data and exporting actionable intelligence. Here is a minimum shopping list of qualities to consider:
1. Data personalization
The first requirement is to move from a data-centric to a use-case method of management. Enterprise-level information must be trimmed and delivered specifically to the needs of the risk manager. This may require the efforts of IT to develop data filtering processes, and to evaluate the value of third-party data streams, such as from insurance carriers or third-party service providers, in order to gather the essential information to formulate a strong set of risk management KPIs.
2. Replace reporting with business analytics
The days of PDF and spreadsheet reporting are waning. New technology allows for user-defined, ad-hoc, scheduled and conditional reporting on any data point in the system. Being able to dive deeply, and to bridge across multiple databases - including third-party real-time feeds - gives the risk manager the ability to recognize relationships, identify trends and gain insights not previously possible. Such systems further govern delivery of data based on individual user permissions and the creation of personalized report libraries.
3. Data visualization
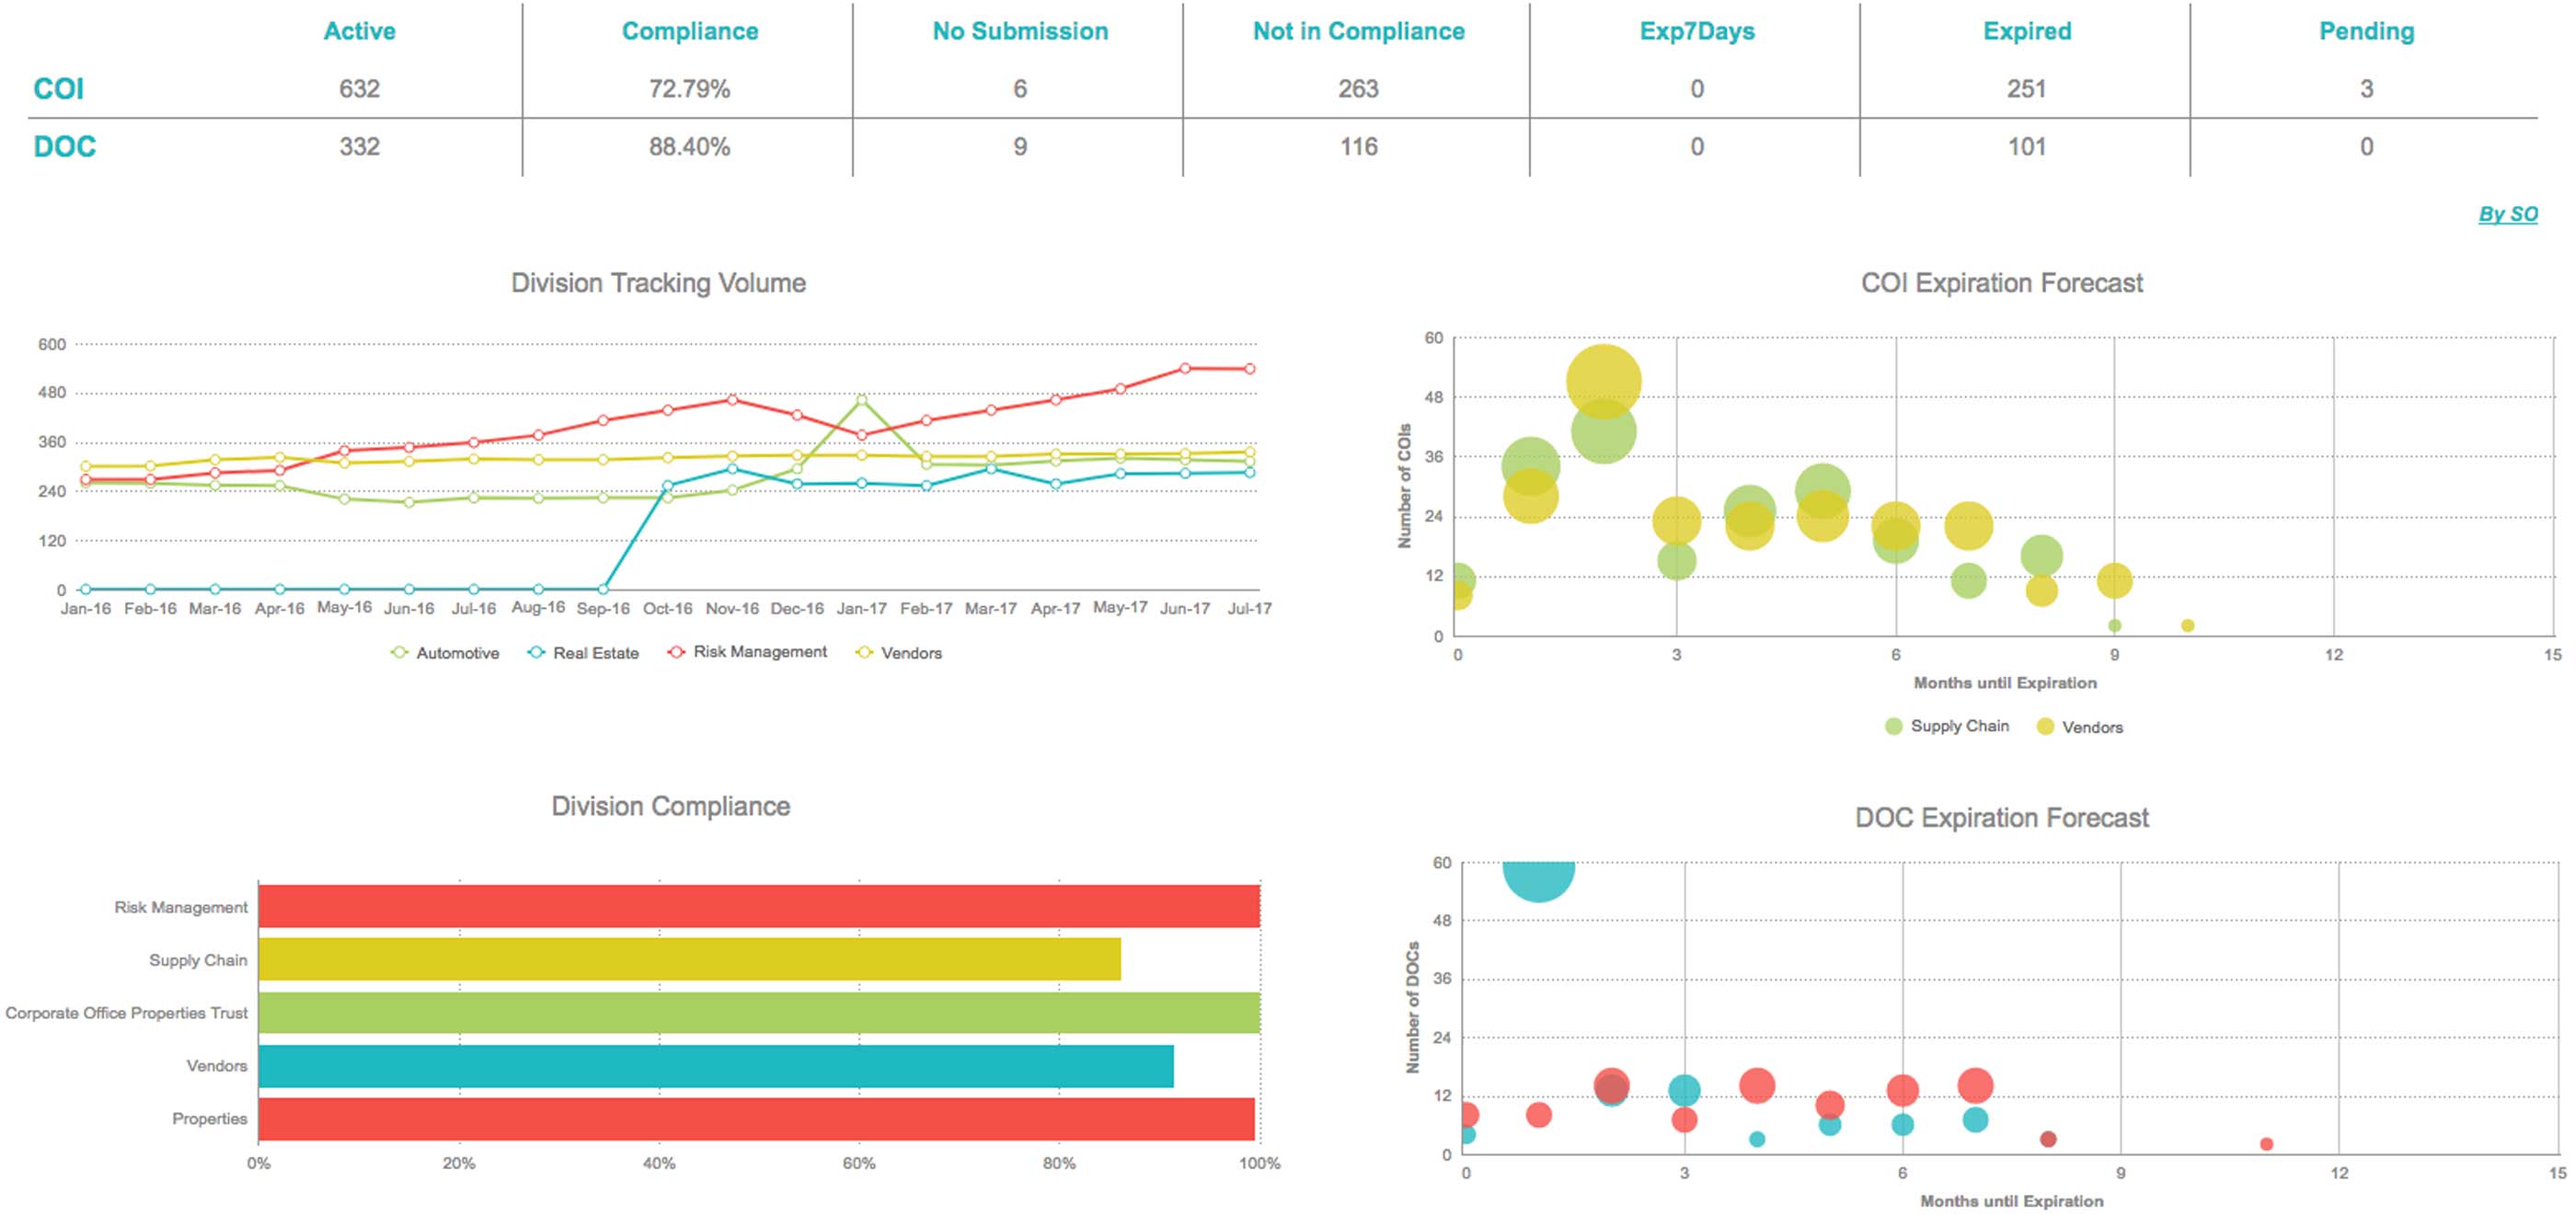
A picture really is worth a thousand words. Looking at vast reams of numerical or tabular data makes it difficult to understand the story within. Nuances can be easily overlooked, thus eroding the value of the information. The emergence of customizable graphical data displays allows for quicker understanding, particularly by non-technical personnel. And typically there are links within the visualization that can be used to drill into the underlying, supporting detail for display or output in multiple formats.
4. Workflow configuration
A configurable workflow is predesigned to adapt to a particular use case. The ability of a solution to be configured, rather than customized, relieves the manager of implementation burdens and reduces the total cost of ownership. The ultimate goal is flexibility, to be able to "bend" the system to the user, not the other way around, and to initiate functional activities, such as alerts, at designated waypoints. Workflows might include the organization of data that mimic existing business processes, thus retaining established procedures and limiting training needs. Although not directly related to risk management, configurable workflows can better control costs, improve the approval / adoption process, and deliver higher returns on investment.
One final note – plan long term. Switching costs are high. Don't box yourself in with tools that do not expand with your needs, your responsibilities, and the organization's growing complexities in the years ahead.
Leave a Comment